Exploratory Data Analysis
Overview
Section titled “Overview”Exploratory Data Analysis (EDA) is a critical first step in any data mining project. For frequent itemset mining, EDA helps us understand the dataset characteristics, identify preprocessing requirements, and make informed decisions about algorithm parameters such as minimum support thresholds.
Data Inspection
Section titled “Data Inspection”Dataset Overview
Section titled “Dataset Overview”The experiments use the Amazon Reviews 2023 dataset from Hugging Face, combining multiple product categories:
- Source: Hugging Face Datasets - McAuley-Lab/Amazon-Reviews-2023
- Categories Used:
- Appliances
- Digital Music
- Health and Personal Care
- Handmade Products
- All Beauty
- Total Records: 4,118,850 reviews (combined across all categories)
- Data Format: JSONL (JSON Lines) format with one review per line
- Category Column: Added during loading to track source category
Dataset Features
Section titled “Dataset Features”The dataset contains the following key features (variables):
Categorical Variables
Section titled “Categorical Variables”user_id(string): Unique identifier for each user/reviewerasin(string): Amazon Standard Identification Number - unique product identifierparent_asin(string, nullable): Parent product identifier for product variantscategory(string): Product category (when combining multiple categories)verified_purchase(boolean): Whether the purchase was verified
Numerical Variables
Section titled “Numerical Variables”overall(float): Rating score (typically 1-5)helpful(list): Helpful vote countsunix_review_time(integer): Unix timestamp of review
Text Variables
Section titled “Text Variables”review_text(string): Review contentsummary(string): Review summary
Basic Statistics
Section titled “Basic Statistics”The EDA process reveals key statistics about the dataset:
Record-Level Statistics
Section titled “Record-Level Statistics”Based on the combined dataset analysis:
- Total Records: 4,118,850 reviews (combined categories)
- Verified Purchases: Varies by dataset; typically 60-80% of records are verified
- Non-verified: 20-40% of records are non-verified reviews
- Unique Users: Hundreds of thousands of unique reviewers across categories
- Unique ASINs (individual products): Tens of thousands per category
- Unique Parent ASINs (product groups): Typically 1.5-2x fewer than individual ASINs
- ASIN/Parent ASIN Ratio: Approximately 2:1, enabling product variant grouping
- Verified Purchases: Percentage varies by category, typically 60-80% of reviews
- Unique Users: Hundreds of thousands of unique reviewers
- Unique Products (ASIN): Tens of thousands of individual products
- Unique Product Groups (Parent ASIN): Fewer than individual ASINs, enabling product grouping
Transaction-Level Statistics
Section titled “Transaction-Level Statistics”After converting reviews to transactions (grouping by user) with preprocessing parameters:
- Configuration Tested:
- Minimum transaction size: 1, 2, 3, 4, 5 (analyzed comparatively)
- Product grouping: Both ASIN (individual) and Parent ASIN (grouped) strategies
- Typical Results (min_transaction_size=2, Parent ASIN):
- Total Transactions: Thousands to tens of thousands depending on category combination
- Average Transaction Size: 2-3 items per user
- Transaction Size Range: 2 items (minimum) to dozens of items (maximum)
- Unique Items: Reduced significantly with Parent ASIN grouping
- User Purchase Patterns:
- Mean purchases per user: 2-3 items
- Median purchases per user: 1-2 items
- Most users (50-70%) make only 1 purchase
- Power law distribution: Few users are highly active
Missing Values
Section titled “Missing Values”The dataset contains several types of missing values:
-
parent_asin: Many products don’t have a parent ASIN (null values)- Handling: Fallback to
asinwhenparent_asinis null - Impact: Affects product grouping strategy
- Handling: Fallback to
-
verified_purchase: Some records may have null values- Handling: Filtered to only include verified purchases (
verified_purchase == True) - Rationale: Ensures data quality and reduces noise from unverified reviews
- Handling: Filtered to only include verified purchases (
-
user_id: Rarely missing, but critical for transaction creation- Handling: Records with missing
user_idare excluded from transaction creation
- Handling: Records with missing
Visualizations
Section titled “Visualizations”The EDA process generates comprehensive visualizations to understand data patterns. The exploration notebook produces the following visualization files:
data-exploration-item-frequency.png- Item frequency distributiondata-exploration-transaction-size.png- Transaction size distributiondata-exploration-support-thresholds.png- Items at different support thresholdsdata-exploration-user-purchases.png- User purchase count distributiondata-exploration-asin-comparison.png- ASIN vs Parent ASIN comparisondata-exploration-top-items.png- Top 15 items by frequency
Key Visualizations
Section titled “Key Visualizations”1. Item Frequency Distribution
Section titled “1. Item Frequency Distribution”
- Purpose: Understand how items are distributed across transactions
- Insights:
- Most items appear infrequently (long tail distribution)
- Few items appear in many transactions (power law distribution)
- Log scale used to visualize full range
- Median frequency shown as reference line
- Helps determine appropriate minimum support thresholds
2. Transaction Size Distribution
Section titled “2. Transaction Size Distribution”
- Purpose: Understand the distribution of items per transaction
- Insights:
- Most transactions contain 1-5 items
- Mean transaction size shown as reference line
- Average transaction size guides preprocessing decisions
- Helps set
min_transaction_sizeparameter
3. Items at Different Support Thresholds
Section titled “3. Items at Different Support Thresholds”
- Purpose: Determine how many frequent itemsets would be found at various support levels
- Insights:
- Shows exponential decay as support threshold increases
- Log scale on y-axis reveals full range
- Support thresholds tested: 0.1%, 0.5%, 1%, 2%, 5%, 10%
- Helps select appropriate minimum support for algorithm execution
- Critical for balancing computational cost vs. result completeness
4. User Purchase Count Distribution
Section titled “4. User Purchase Count Distribution”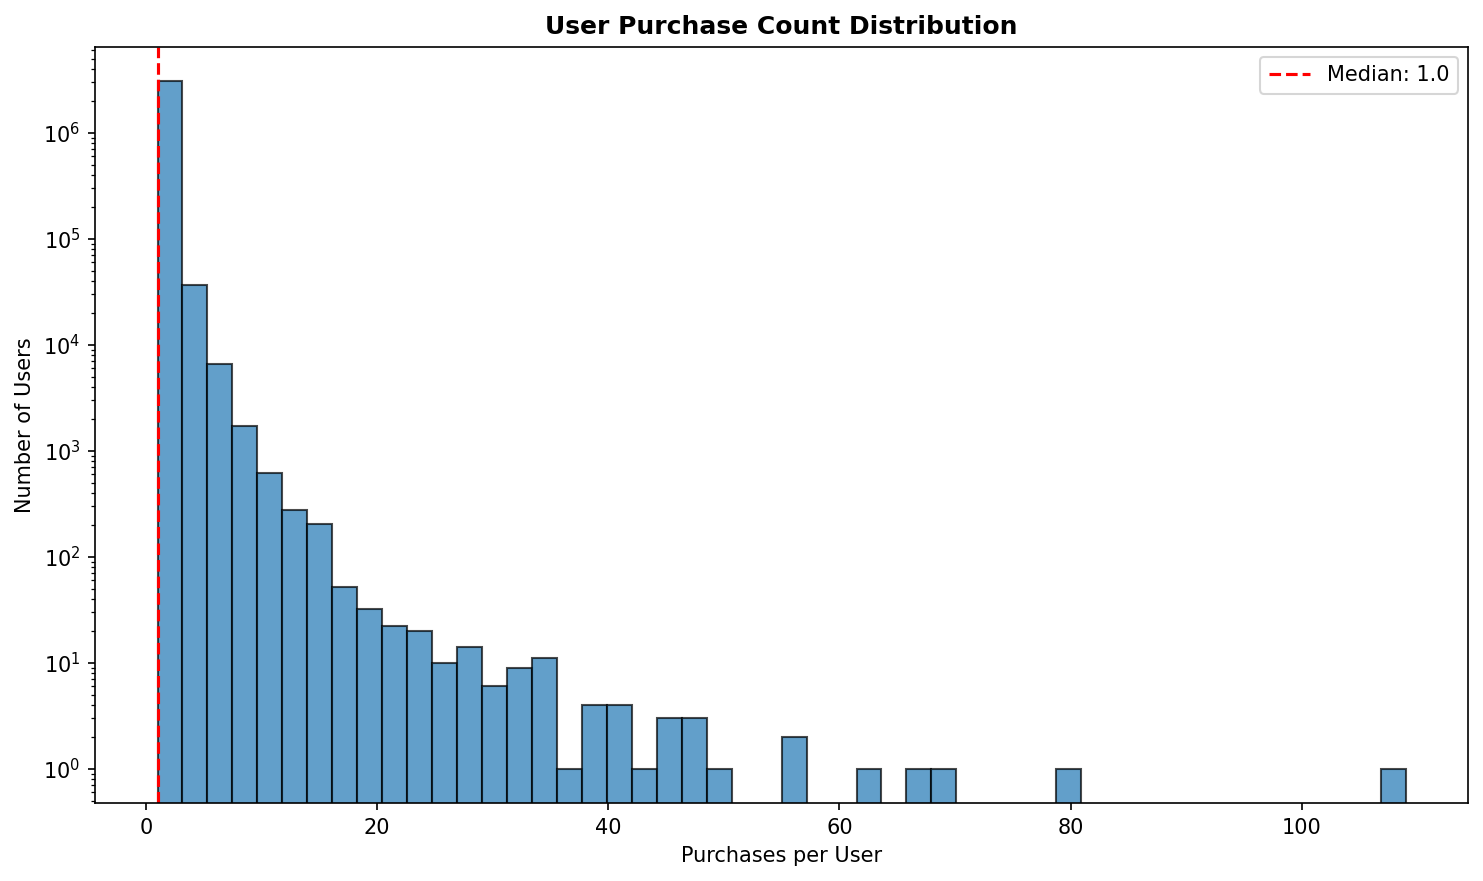
- Purpose: Understand user purchasing behavior
- Insights:
- Most users make few purchases (1-2)
- Few users are highly active (power users)
- Log scale reveals power law distribution
- Median purchase count shown as reference
- Affects transaction creation strategy
5. ASIN vs Parent ASIN Comparison
Section titled “5. ASIN vs Parent ASIN Comparison”
- Purpose: Compare product granularity strategies
- Insights:
- Parent ASIN grouping reduces item count
- Parent ASIN creates more meaningful product associations
- Comparison across different minimum transaction sizes (1-5)
- Log scale shows impact across all transaction sizes
- Helps decide between individual products vs. product groups
6. Top Items by Frequency
Section titled “6. Top Items by Frequency”
- Purpose: Identify most popular products
- Insights:
- Reveals best-selling or frequently reviewed products
- Horizontal bar chart for readability
- Top 15 items displayed
- Helps understand domain-specific patterns
- Useful for result interpretation
Insights
Section titled “Insights”Key Patterns and Trends
Section titled “Key Patterns and Trends”1. Power Law Distribution
Section titled “1. Power Law Distribution”The dataset exhibits strong power law characteristics:
- Item Frequency: Most items appear in very few transactions, while a small number of items appear in many transactions
- User Activity: Most users make few purchases, while a small number of users are highly active
- Implication: Low minimum support thresholds are necessary to capture meaningful patterns
2. Transaction Sparsity
Section titled “2. Transaction Sparsity”- Observation: Average transaction size is small (2-3 items)
- Implication:
- High-dimensional sparse data
- Traditional Apriori may generate many candidates
- FP-Growth may be more efficient due to tree compression
3. Product Grouping Benefits
Section titled “3. Product Grouping Benefits”- Observation: Using
parent_asininstead ofasin:- Reduces unique item count significantly
- Creates more meaningful associations (product variants grouped together)
- Increases average transaction size
- Implication: Better for association rule mining as it captures product family relationships
4. Support Threshold Sensitivity
Section titled “4. Support Threshold Sensitivity”- Observation: Small changes in support threshold dramatically affect number of frequent itemsets
- Example: Reducing support from 1% to 0.5% may double the number of frequent itemsets
- Implication: Careful threshold selection is critical for algorithm performance
Relationships Between Variables
Section titled “Relationships Between Variables”User-Product Relationships
Section titled “User-Product Relationships”- Pattern: Users typically purchase products within similar categories
- Relevance: Suggests category-based analysis may reveal stronger patterns
- Application: Can be used for recommendation systems
Product Co-occurrence Patterns
Section titled “Product Co-occurrence Patterns”- Pattern: Certain products frequently appear together in transactions
- Relevance: Core of association rule mining
- Application: Market basket analysis, product recommendations
Temporal Patterns
Section titled “Temporal Patterns”- Pattern: Purchase patterns may vary over time (not explored in detail)
- Relevance: Could inform time-sensitive association rules
- Application: Seasonal product recommendations
Preprocessing Decision Support
Section titled “Preprocessing Decision Support”EDA directly informs preprocessing decisions:
-
Minimum Transaction Size:
- Decision: Use
min_transaction_size=2(transactions must have at least 2 items) - Rationale: Single-item transactions don’t contribute to association rules
- Impact: Reduces transaction count but improves quality
- Decision: Use
-
Product Grouping Strategy:
- Decision: Use
parent_asinwhen available, fallback toasin - Rationale: Captures product family relationships, reduces sparsity
- Impact: More meaningful association rules, better algorithm performance
- Decision: Use
-
Minimum Support Threshold:
- Decision: Use very low thresholds (0.05% - 0.5%) for comprehensive analysis
- Rationale: Power law distribution means most items are infrequent
- Impact: Balances completeness vs. computational cost
-
Infrequent Item Filtering:
- Decision: Filter items appearing in fewer than 3 transactions
- Rationale: Removes noise, reduces computational overhead
- Impact: Faster algorithm execution, cleaner results